
Upon Further Review 2Q 2023: Inopinatum Expectus & Leading Economic Indicators
07/12/23
Introduction to the Market Commentary
Looking back at the events that transpired across financial markets in the first half of 2023, we can’t help but think of an old Latin proverb: inopinatum expectus, or “expect the unexpected.” The widely held expectation of a tough 1H 2023 outlook for equities was almost instantly thrown out the window: US equity indices came out of the gate strong and extended their rally from the first quarter into the second. In fact, the Nasdaq-100 Technology Sector Index just posted its best ever first-half result. Its return of +39.4% YTD was driven almost entirely by the “magnificent seven¹” and generative AI mania. Meanwhile, bond markets continue to largely ignore the “don’t fight the Fed” mantra, pricing in fewer interest rate hikes, a lower terminal rate, and quicker than expected 2024 rate cuts. What might the 2H 2023 markets have in store? While difficult to predict, we believe the outcome may be informed by the topic of this quarter’s Upon Further Review installment: Leading Economic Indicators.
Take the Lead
Economic indicators “are variables that provide information on the state of the overall economy2” and serve as an invaluable lens to determine the economy’s current position within the traditionally defined business cycle. Of the three types of economic indicators (leading, coincident, and lagging), leading economic indicators understandably get the most attention as a predictive measure of the near-term economic and business outlook. Leading economic indicators can take all shapes and sizes. Former longtime Federal Open Market Committee (FOMC) Chairman Alan Greenspan reportedly tracked sales of men’s underwear for clues on potential directional changes in the economy, since it is the least visible and indiscernible form of clothing and therefore the most likely expense to be cut during belt-tightening.
While the concept of leading economic indicators is relatively straightforward, investigating the intricacies and inter-relationships between distinct data points can provide tremendous insights. Economic data readings take two forms: hard data and soft data. Hard data consists of data marks that are considered more “tangible”, such as gross domestic product, industrial production, and monthly retail sales. On the other hand, soft data refers to economic statistics that represent measures less definable and more varied. A survey of consumer confidence is an example of soft data, as it has different answers per respondent making its data more “directional” and relative in nature. Additionally, the interval of time from when one economic data point informs another can vary greatly. Some periods can be as brief as a few weeks, while other relationships don’t show their impact for over a year. Exhibit 1 shows clearly the breadth of economic categories along with their leading indicators and expected intervals.
EXHIBIT 1
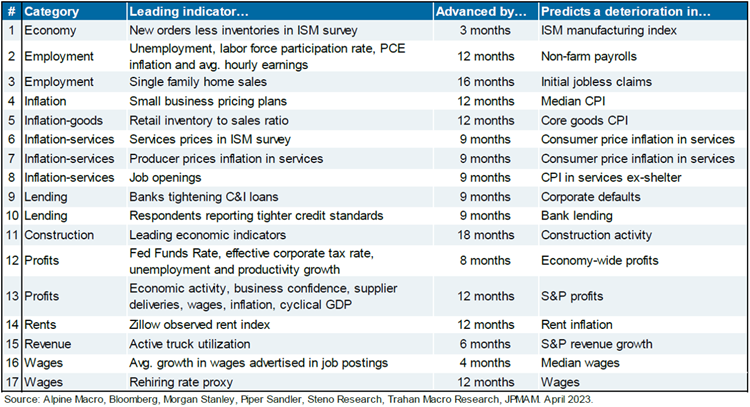 Source: JPMorgan Michael Cembalest Eye on the Market Note April 2023
The Leading Economic Index
With a framework of leading economic indicators now established, we can now turn our focus to one economic data point that serves as a vital clue to the health of the economy: The Conference Board Leading Economic Index® (also known as the LEI, or Leading Index). Created in 1959 and published monthly, the LEI is “constructed to summarize and reveal common turning points in a clearer and more convincing manner than any individual component.3” The Leading Index comprises two main components: Financial Components (incorporating credit conditions, equity prices, and fixed income interest rate differentials) and Non-Financial Components (measuring data points such as manufacturing activity, housing measures, wages and jobs, and business condition expectations). The main components are comprised of contributing subcomponents. The individual values of each subcomponent is weighted by a standardization factor to reflect its importance to the overall economy. Exhibit 2 below illustrates the most recent May 2023 monthly release of the changes in each of the subcomponents, measured at monthly and six-month measurement periods.
What makes the Leading Economic Index of such great relevancy? First, the Leading Index (advanced six months) is highly correlated to US GDP growth and therefore is one of the most trusted forward-looking indices. More crucially, the underlying LEI data dating back to inception provides phenomenal context for data analysis. By our internal calculations, across 767 monthly readings in LEI history, the six-month annualized percentage change in the reading registered -3.00% or lower 94 times. Of those 94 instances, 85 have occurred surrounding a technically defined recessionary period as defined National Bureau of Economic Research⁴ seven before, 65 during, and 13 immediately following. The nine instances that the LEI registered -3.00% or lower that are not during a technically defined recession all occurred in the most recent period of September 2022 through May 2023.
EXHIBIT 2
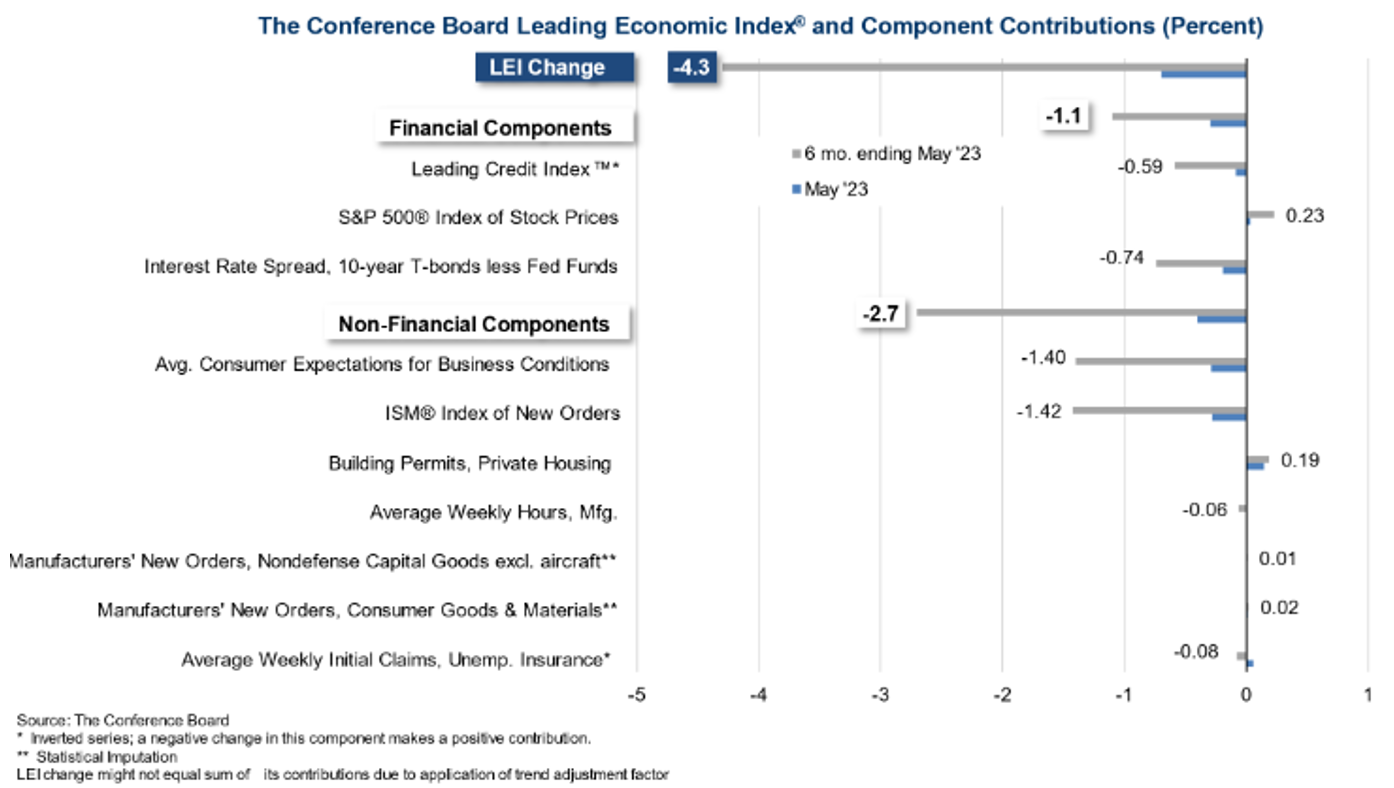 Source: The Conference Board
Implications to 2H 2023 Outlook
The exhibits above imply weakening leading economic conditions could roll over and soon be reflected in upcoming GDP data. This might seem to imply a recession is imminent. Not necessarily.
The final 1Q 2023 GDP print of 2.0% was revised higher, largely on reduced inventory levels and better-than-expected consumer spending figures, while the Fed Atlanta’s GDPNow forecast for 2Q 2023 currently sits above 2.0% (both figures on a seasonally adjusted annualized basis). Even FOMC Chairman Jerome Powell has repeatedly stated publicly that he does not see a recession on the horizon, although many of his fellow FOMC board members disagree. Meanwhile, soft data – such as credit card spending and travel and leisure demand – point to a healthy US consumer, at the same time that hard data like the ADP® National Employment Report and monthly nonfarm payroll releases continue to serve as a tailwind to buoyant labor markets. Much as it may be unwise to “fight the Fed,” the American consumer’s propensity to spend is a formidable foe, and one not to be taken lightly as it potentially bolsters the “no landing/soft landing” scenario.
On the other hand, the Leading Economic Index and the 10-Year/3-Month Treasury spread are powerful economic data points that provide empirical evidence of an elevated probability of a pending recession.
No landing, soft landing, or hard landing? And how will equity and bond markets react after a lively 1H 2023? To be determined…expect the unexpected, indeed.
To discuss more with an expert or put your financial plans into perspective, contact a member of our wealth management team.
REFERENCES
¹Magnificent Seven: Alphabet, Amazon, Apple, Meta, Microsoft, Nvidia and Tesla.
²CFA Institute: Understanding Business Cycles. https://www.cfainstitute.org/-/media/documents/protected/refresher-reading/2023/RR-2023-L1V2R4-understanding-business-cycles.pdf
³The Conference Board May 2023 Press Release: https://www.conference-board.org/topics/us-leading-indicators
⁴Bloomberg Data Set: LEI TOTL Index 1.31.59-5.31.23
DISCLOSURES
For more information about our Wealth Management services, speak to your relationship manager or visit the Wealth Management pages of SunflowerBank.com and FirstNational1870.com.
Investment and insurance products are not FDIC-insured, are not a deposit or other obligation of, or guaranteed by the bank or an affiliate of the bank, are not insured by any federal government agency and are subject to investment risks, including possible loss of the principal amount invested.
General disclosure: This material is intended for information purposes only, and does not constitute investment advice, a recommendation or an offer or solicitation to purchase or sell any securities to any person in any jurisdiction in which an offer, solicitation, purchase or sale would be unlawful under the securities laws of such jurisdiction. This material may contain estimates and forward-looking statements, which may include forecasts and do not represent a guarantee of future performance. This information is not intended to be complete or exhaustive and no representations or warranties, either express or implied, are made regarding the accuracy or completeness of the information contained herein. The opinions expressed are as of July 12, 2023, and are subject to change without notice. Reliance upon information in this material is at the sole discretion of the reader. Investing involves risks.