
Upon Further Review 3Q 2023: The Current Situation of Valuation Dislocation
10/10/23
Introduction
Financial markets have provided a smorgasbord of performance results across asset classes and indices through the first three quarters of 2023. The S&P 500 is up +13.1% year-to-date, the Nasdaq Composite +27.1%, and the MSCI EAFE Index +7.6% through the first nine months. Meanwhile, fixed income has had a much tougher slog in 2023, with the Bloomberg US Aggregate index returning -1.2% year-to-date through September. The 10-year Treasury yield has risen nearly 100 basis points in 2023 to levels not seen since 2007 - with ~60 basis points1 of widening in the last month alone - threatening to end the year with an unprecedented third consecutive annual loss. Oil has continued its march higher, with Brent crude hitting $95/barrel as a result of healthy demand and OPEC+ production cuts. 3Q 2023 US GDP growth is projected to be stronger than initially anticipated, owing largely to robust consumer spending, before slowing somewhat in the final quarter. Potential economic headwinds into 4Q 2023 include rising oil prices, a prolonged United Auto Workers union strike, a(nother) potential US government shutdown in November and last but certainly not least, the “long and variable” lagged effects of tighter monetary policy. It is against this backdrop that we focus this installment of Upon Further Review on equity relative valuations, multiple expansion, and market implications heading into 2024.
Equity Valuation Measures & Earnings Estimates
Determining equity valuations can take many forms, both at the security and the broader market level. Relative valuation measures such as price-to-earnings, price-to-book value, price-to-free cash flow and dividend yield have proven to be reliable metrics — when viewed against their historical averages — by comparing the current relative valuation and thus the influence on potential future returns. While for the purposes of this analysis we will focus primarily on forward price-to-earnings ratio (forward P/E) and implications to market valuation, Exhibit 1 provides current levels of the aforementioned metrics relative to their 25-yyear averages.2
EXHIBIT 1
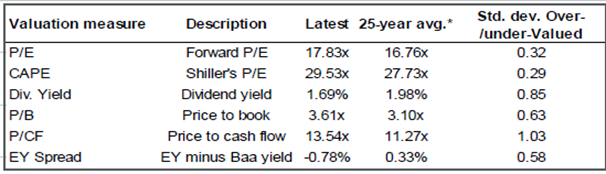 Source: JPMorgan Asset Management 4Q 2023 Guide to the Markets
Forward Price to Earnings is calculated as the current market price of the index divided by the estimated earnings per share over the ensuing 12 months. It is predominantly driven by company fundamentals and its future growth prospects, meaning the higher the expected level of growth, the more deserving the company of a relatively higher multiple as its earnings are expected to “grow” into its valuation. Indeed, empirical evidence shows that earnings ultimately move long-term market returns more so than the Price/Earnings multiple, as the multiple displays less variability and is mean-reverting over longer observation periods3. Meanwhile, Earnings Estimates are driven by three main components: revenues, operating margins, and changes to the number of shares outstanding. As a result, better-than-expected revenue growth, higher margins, and fewer shares (via buybacks) can all serve as a tailwind to earnings per share (EPS) results.
Forward P/E levels can be used to compare an individual equity position to the broader market index, the company’s primary competitors, and its own historical levels to determine if a company appears over/undervalued, potentially informing expected future returns. As the earnings estimates of each individual company in an index are amalgamated, the result is the forward earnings estimate of the entire index.
Multiple Expansion & Valuation Dislocations
While earnings growth ultimately is the prevalent driver of equity and index returns over longer periods, short-term price dislocations are often associated with multiple expansion. The first three quarters of 2023 have provided an acute example of multiple expansion, both at the security level (more on that in a moment) and on the broader indices (as proxied here by the S&P 500). Owing almost exclusively to the rapid rise of generative artificial intelligence (AI) and large language models (LLM), a “re-rating” on P/E multiples began transpiring in 1Q 2023 in companies which stand to benefit most from this novel and potentially disruptive technology: a classic example of market participants expecting a company to grow into its future valuation on stronger sustained earnings.
The findings through three quarters are almost inconceivable: the top 10 largest equity weightings in the S&P 500 explain 97% of the S&P 500’s +13.1% performance year-to-date, with the remaining 490 essentially flat on the year4. Seven of the 10 companies, as you may imagine, are the mega cap technology companies expected to benefit most from the future benefits of AI and LLM, with a median forward P/E among the seven of 36.1 times earnings. As a result of this material divergence between these two sample sets, the top 10 largest names in the S&P 500 now account for 31.9% of the total market capitalization of the index, while only contributing 21.9% of the earnings contribution to the index5. This is a classic example of multiple expansion and the corresponding value dislocation. Exhibit 2 demonstrates this relationship graphically between the two subsets, while also providing current price to earnings ratios, this time relative to their 28-year historical averages.
EXHIBIT 2
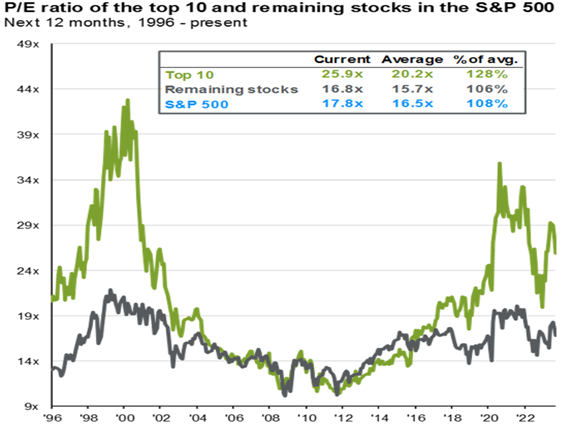 Source: JPMorgan Asset Management 4Q 2023 Guide to the Markets
Implications for 2023 & Beyond
As evidenced by the two exhibits above, the current S&P 500 valuation appears to be priced slightly above its fair market value, as measured against the aforementioned historical relative valuation metrics. A similar approach taking forward consensus S&P 500 earnings estimates and measuring relative to the five- and 10-year average also warns of muted return upside over the next twelve months6. On the other hand, when the S&P 500 registers a +10-20% gain through the first three quarters of the year (as it has this year), fourth quarter S&P 500 index returns have been positive in 17 of 19 instances dating back to 1950, with a median average fourth quarter return of +5.5%7…fanning hopes of a year-end rally. Market bulls see potential macro tailwinds, a Fed pivot, stronger-than-expected earnings growth or a re-rating of the forward multiple to drive returns in 4Q 2023 and into 2024. Market bears fear a “higher for longer” FOMC posture, rising real rates — and corresponding 20-year low Equity Risk Premium — will drag the forward multiple lower, almost regardless of what earnings do in 2024. The Sunflower Bank Investment Team remains confident in our current portfolio positioning, specifically our developed international equities exposure (offering more forgiving relative valuations) and the composition of our fixed income portfolio providing an additional layer of diversification.
While we certainly can’t predict what awaits equity markets for the remainder of 2023 and beyond, keeping a close eye on the movements in equity relative valuations will certainly help tell the story. Stay tuned…we certainly will be.
REFERENCES
1 As of the time of this writing (10.4.23), the US 10-Year Treasury is yielding 4.735%. It closed August 2023 at 4.108%
2 Data as of 9.30.23
3 Ma, Henry, 2018; Earnings Growth Drives Market Return in the Long Run, But Not in the Short Run.
4 & 5JPMorgan Asset Management 4Q 2023 Guide to the Markets®
6 Using an approximation of $240 NTM EPS and measured against the five- (18.7x) and 10-year (17.5x) equates to 12-month forward S&P 500 levels of 4,488 and 4,200, respectively.
7 Hamilton Lane Weekly Research Briefing 9.26.23; Carson Investment Research
DISCLOSURES
For more information about our Wealth Management services, speak to your relationship manager or visit the Wealth Management pages of SunflowerBank.com and FirstNational1870.com.
Investment and insurance products are not FDIC-insured, are not a deposit or other obligation of, or guaranteed by the bank or an affiliate of the bank, are not insured by any federal government agency and are subject to investment risks, including possible loss of the principal amount invested.
General disclosure: This material is intended for information purposes only, and does not constitute investment advice, a recommendation or an offer or solicitation to purchase or sell any securities to any person in any jurisdiction in which an offer, solicitation, purchase or sale would be unlawful under the securities laws of such jurisdiction. This material may contain estimates and forward-looking statements, which may include forecasts and do not represent a guarantee of future performance. This information is not intended to be complete or exhaustive and no representations or warranties, either express or implied, are made regarding the accuracy or completeness of the information contained herein. The opinions expressed are as of October 5th, 2023, and are subject to change without notice. Reliance upon information in this material is at the sole discretion of the reader. Investing involves risks.