
Upon Further Review 4Q2023: What to Expect in an Election Year?
01/16/24
Introduction
The final quarter of 2023 saw financial markets largely resilient in the face of an abundance of potential headwinds. The S&P 500 closed out the year returning +26.3%, while the Nasdaq Composite Index (+44.7%) and Dow Jones Industrial Average (+16.2%) briefly touched their respective record highs in December 2023. In fixed income, the Bloomberg US Aggregate Index narrowly avoided an unprecedented three-year consecutive decline on the back of a strong 4Q 2023 performance, returning +5.5% to close the year. The 10-year Treasury also rallied mightily into year-end, shedding over 100 basis points in the final quarter on expectations of lower interest rates due to the much-anticipated Fed pivot. Volatility (as proxied by the VIX and MOVE indices for equities and fixed income, respectively) remains relatively muted, despite numerous looming market and geopolitical risks. Looking ahead to 2024, market consensus currently calls for potentially five quarter-point interest rate cuts1, with the FOMC’s ability to engineer their desired “soft-landing” outcome that is top of the market’s mind. In this installment of Upon Further Review, we explore historical domestic market performance in past election years and possible implications for the year ahead.
2024: The Largest Election Year in History
Before turning our sights to the United States, it’s worth nothing that 2024 will see more people across the globe head to the ballot box than ever before2, with over four billion people participating in presidential, legislative, or local elections. In addition to the United States, imperative elections are due in the United Kingdom, India, Taiwan, and Mexico, with a likely “snap” election also expected in Japan. The European Parliament elections slated for June 2024 also weigh heavily, marking another potential wild card. Regardless of who is to inhabit 1600 Pennsylvania Avenue following the 2024 US election, the possibility of material changes to the political environment of multiple vital US allies creates an additional layer of uncertainty. As a result, the global geopolitical landscape could look vastly different a year from now than it does today.
People in Countries with an Election That Year (bn)
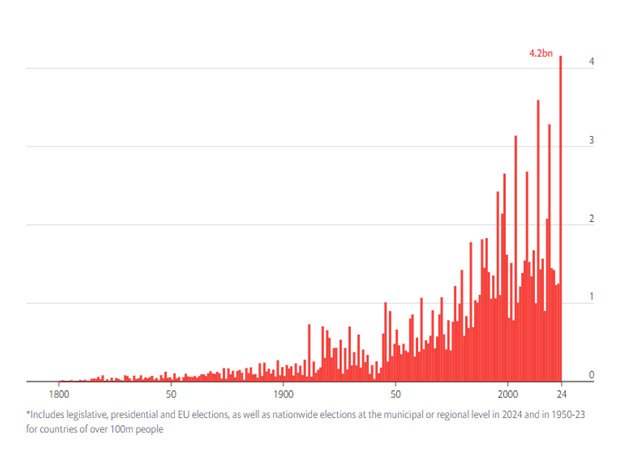
Source: The Economist
Domestic Market Performance in Election Years
What to expect from markets in an election year? If history is any guide, 2024 could very well shape up to be a good year for domestic equities and bonds alike. By our internal calculations, over the past 20 US presidential election years dating back to 1944, the S&P 500 Index has posted gains in 18 of the 20 years – an impressive clip of 90% - averaging a total return of +10.9%. Meanwhile, domestic fixed income (as proxied by the Bloomberg US Aggregate Index) has posted positive total returns across all 12 readings, averaging +7.2%, outpacing its annualized equivalent total return across all years since inception3 of +6.6%. Interestingly, the victorious party of each of the past 20 elections is split evenly at 10 Democrats and Republicans alike, although a difference in the average positive performance of each party can be seen. In years in which a Republican was elected President, the average total return measured +12.4%, while in years of a Democratic victory, the average total return registered a +9.4% gain.4
The only two election years not to see the S&P 500 end the year in the green were 2000 and 2008 – both of which coincided with a recession, relatively mild in the case of the former and significant in the latter. In fact, excluding the S&P 500 Index’s abysmal -37.0% return in 2008, average returns in years of a Democratic presidential election victory would equal +14.5%.
S&P 500 Index Total Return Per Election Year
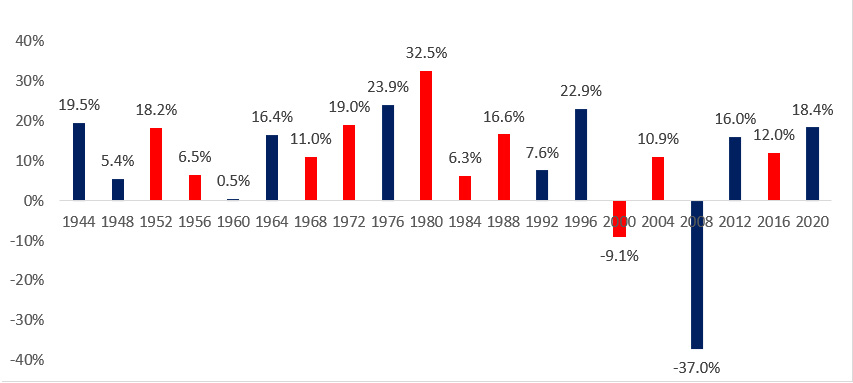
Source: Sunflower Bank & Bloomberg
However not all election years are created equally. In the seven instances of election years in which an incumbent President of either party was re-elected, total average equity returns registered +14.4%. What’s more, some monthly seasonality has been exhibited in election years. Dating back to 1972, average monthly returns in election years have registered positive in eight of the 12-month intervals, turning negative in the two months prior to the election before reversing course in November and December.5 Generally speaking, markets hate uncertainty, and the prospect of “known unknowns” as an election beckons no doubt can serve as reason to give market participants pause.
2024: The Year Ahead
Though history has been kind to domestic equity and fixed income markets in recent election years, caution is nonetheless warranted as 2024 commences. For one, the 2024 United States election poses peculiarities never witnessed in past election cycles, and the primary season may very well upend the current narrative of a Biden/Trump rematch. Secondly, geopolitical risks – specifically the ongoing Russia/Ukraine war and simmering US tensions with China, as well as the possibility of a commodity shock should the Israel/Hamas conflict broaden within the Middle East - have the potential to rattle market sentiment.
Entering 2024, we are of the mindset that the predominant driver of equity and fixed income performance will be the economic data that ultimately determines the path of central bank easing - both domestically and abroad - and not election winners or losers. We remain steadfast in our conviction of carefully crafted, diversified portfolios viewed over a long-term investment horizon. Whatever 2024 may bring, we will be keenly watching, and as always, are honored to serve our valued clients.
References
1 At the time of this writing (1.11.24), US Fed Fund Futures interest rate probabilities indicate 145 basis points in FOMC interest rate cuts for CY 2024. Source: Bloomberg WIRP
2 The Economist: The World Ahead https://www.economist.com/interactive/the-world-ahead/2023/11/13/2024-is-the-biggest-election-year-in-history November 2023
3Bloomberg US Aggregate Index Inception Date: 1.30.76
4Sunflower Bank Internal Calculations. SPX & LBUSTRUU Indexes Annual Total Returns in Presidential Election Years dating to 1944 & 1976, respectively. Source: Bloomberg. Accessed January 2024. Data available upon request
5Capital.com: Average Monthly Returns in Presidential Election Years Graphic https://capital.com/stock-market-seasonal-trends-when-is-the-best-and-worst-time-to-invest-in-stocks September 2022
Index Definitions
The S&P 500 Index is a market-capitalization weighted index that seeks to track the performance of 500 widely held stocks in the US equity market. The Bloomberg US Aggregate Index is a broad-based flagship benchmark that measures the investment grade, US dollar-denominated, fixed-rate taxable bond market. The performance of an index is not an exact representation of any particular investment, as you cannot invest directly in an index.
Disclosures
For more information about our Wealth Management services, speak to your relationship manager or visit the Wealth Management pages of SunflowerBank.com and FirstNational1870.com.
Investment and insurance products are not FDIC-insured, are not a deposit or other obligation of, or guaranteed by the bank or an affiliate of the bank, are not insured by any federal government agency and are subject to investment risks, including possible loss of the principal amount invested.
General disclosure: This material is intended for information purposes only, and does not constitute investment advice, a recommendation or an offer or solicitation to purchase or sell any securities to any person in any jurisdiction in which an offer, solicitation, purchase or sale would be unlawful under the securities laws of such jurisdiction. This material may contain estimates and forward-looking statements, which may include forecasts and do not represent a guarantee of future performance. This information is not intended to be complete or exhaustive and no representations or warranties, either express or implied, are made regarding the accuracy or completeness of the information contained herein. The opinions expressed are as of January 16, 2024, and are subject to change without notice. Reliance upon information in this material is at the sole discretion of the reader. Investing involves risks.