.jpg?width=1000&height=334&ext=.jpg)
Upon Further Review 3Q 2022: The Beveridge Curve
10/18/22
INTRODUCTION
It has been a remarkably difficult year for financial markets. Global equity indices have descended into bear market territories, inflation has risen to 40-year highs, and perhaps most surprisingly, core fixed income (as measured by the Bloomberg Barclays US Aggregate) has declined by -14.6% through 3Q 2022 – the worst drawdown in over 50 years. At the center of it has been the Federal Reserve engineering the most aggressive rate hiking cycle on record. A question we expect you may be asking is: when can we expect the downturn to stop? We believe an answer to that question may be found in a lesser-known measure called the Beveridge Curve, and this topic kicks off our new quarterly commentary series, Upon Further Review.
THE FED MANDATE (JOBS & PRICES)
The Fed is currently raising interest rates (specifically, the federal funds rate) in an effort to slow economic growth. The final federal funds rate that they believe will fit their dual mandate of full employment and stable prices is called the “terminal rate.” At the close of 3Q 2022, the terminal rate target was around 4.6%. At the Federal Open Market Committee (FOMC) meeting on September 21, the FOMC raised the fed funds rate target by 75 basis points (or three quarter-point hikes) to the current level of 3.25%, where the rate will remain until the next meeting on November 2, 2022, giving us one signal as to when this hiking cycle may end.
Unfortunately for market watchers, the terminal rate is a moving target and an inexact science. On one hand, the labor markets remain robust post-pandemic…perhaps too robust. On the other hand, unprecedented fiscal and monetary policy set the world awash with currency, while ongoing dislocations within supply chains and geopolitics continue to move the goalposts. Let us look at each of these mandate aims – Jobs & Prices – in more detail to see where we currently stand.
-
Jobs: Remote work and the (r)evolution of city centers helped contribute to a reshuffling of the labor norms deck. As a result, employee satisfaction became more en vogue to the average worker, ultimately leading to an employee “buyer’s market” of sorts. These trends contributed to both a decline in the level of unemployment and an uptick in job openings. Current unemployment levels are consistent with the Fed’s goal; however, there are underlying effects contributing to higher inflation, as we will discuss next.
-
Prices: Inflation began its march upward beginning in 2Q 2021, with year-over-year CPI rising from 2.6% in March 2021 to a high of 9.1% in June 2022. The key driver, in our view, will be the velocity at which inflation recedes and the knock-on effect to Fed policy throughout 4Q 2022 and beyond. The Fed is most concerned with inflation expectations becoming embedded – alternatively, entrenched – if the American consumer eventually just accepts higher prices as the cost of doing business.
THE BEVERIDGE CURVE (OPEN JOBS TO UNEMPLOYMENT)
Most headlines we read today focus on combating inflation; however, we believe the key to unlocking the current cycle lies within the labor market. To be counted as unemployed, an individual must be out of work and actively looking to re-enter the labor force.
Historically, when fewer people are actively looking for jobs, there tends to be a higher number of job vacancies (hence, an inverse relationship). This dynamic is captured in the Beveridge Curve. Developed in 1958 and named after its founder, William Beveridge, the Beveridge Curve shows the relationship between job openings and the unemployment rate.
Currently, the Beveridge Curve suggests the labor market is showing signs of dislocation. Per Bloomberg*, “over the past 12 months, this ratio…has recorded the highest readings in the series’ 70-year history.” The unemployment rate for September 2022 registered 3.5%, while the vacancy rate came in at 1.7 job openings for each unemployed job seeker (10.1 million job openings per the August 2022 JOLTS report). Never have there been so many job openings competing for so few potential workers. * Bloomberg Intelligence - US INSIGHT: Hold My Beveridge 9.28.22
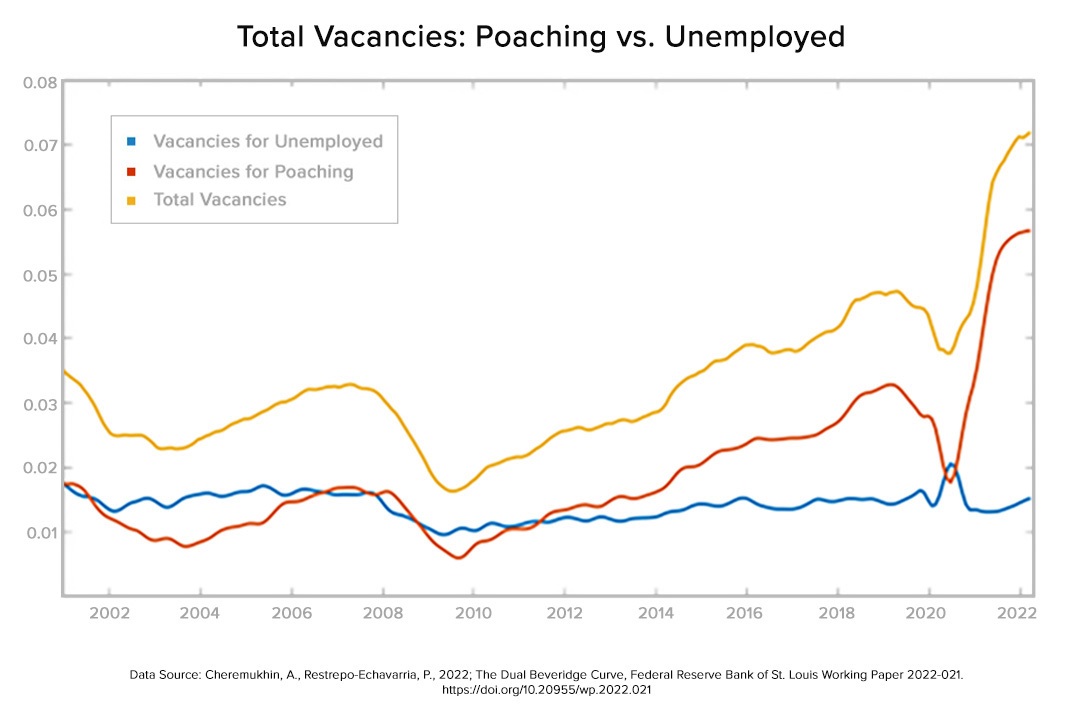
One explanation for why there are so many job openings comes from a recent working paper from Dallas Fed economist Anton Cheremukhin and St. Louis Fed economist Paulina Restrepo-Echavarria (The Dual Beveridge Curve, FRB St. Louis Working Paper No. 2022-21). The paper notes that total vacancies are driven by companies looking to hire away existing workers (or “poaching,” as the authors describe it) rather than looking to hire those currently out of the labor force and looking to re-enter.

IMPLICATIONS TO CURRENT-DAY & NEAR-TERM ECONOMIC OUTLOOK
What results from so many companies competing for smaller sets of workers? Firms begin to raise wages to attract employees. Rising wages thereby help to further fan the inflation fire, as households have more money to spend on goods and services.
As a result, the Fed is in a paradox of sorts, whereby they would actually prefer to see a decline in the number of total job vacancies as a means of bringing down wages. Hence the paradox… the FOMC is acting in direct contradiction to one side of their stated mandate (full employment), in order to assuage the other (inflation).
Whether the Fed will be successful in lowering inflation without a material spike in unemployment (the widely coined “soft landing”) is yet to be seen. Will employees eventually become content in their current positions and become less likely to job hop should broader measures of consumer sentiment sour (based on a level of comfort in their current positions)? Alternatively, will rising prices create a feedback loop, leading workers to continue to seek higher wages to keep pace (and continue to job hop)?
The Fed’s ultimate aim is to create an ideal balance between employment and prices. We believe the story on inflation cannot be told without considering jobs. While the FOMC continues in their fight, we will continue to monitor the economic data and consider the outcomes, from Wall Street to Main Street.
For more information about our Wealth Management services, speak to your relationship manager or visit the Wealth Management pages of SunflowerBank.com and FirstNational1870.com.
Investment and insurance products are not FDIC-insured, are not a deposit or other obligation of, or guaranteed by the bank or an affiliate of the bank, are not insured by any federal government agency and are subject to investment risks, including possible loss of the principal amount invested.
General disclosure: This material is intended for information purposes only, and does not constitute investment advice, a recommendation or an offer or solicitation to purchase or sell any securities to any person in any jurisdiction in which an offer, solicitation, purchase or sale would be unlawful under the securities laws of such jurisdiction. This material may contain estimates and forward-looking statements, which may include forecasts and do not represent a guarantee of future performance. This information is not intended to be complete or exhaustive and no representations or warranties, either express or implied, are made regarding the accuracy or completeness of the information contained herein. The opinions expressed are as of Oct. 18, 2022 and are subject to change without notice. Reliance upon information in this material is at the sole discretion of the reader. Investing involves risks.